

.png?width=73&name=image%20(3).png)

A strip diagram is a pictorial model students can draw to represent a mathematical relationship or to develop understanding of a math concept. Strip diagrams are useful for solving many different types of math problems but are commonly used with word problems. Students can use a strip diagram to organize information and communicate their mathematical thinking.
Start with strip diagrams early.
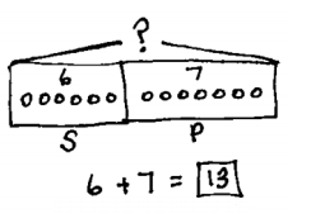
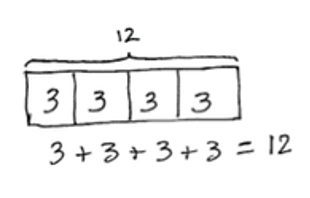
Eureka Math TEKS® introduces strip diagrams as early as Grade 1 with addition and subtraction to reinforce the part–whole relationship. The use of strip diagrams supports students’ transition from concrete models to representational and symbolic models. The following Grade 1 example shows how to introduce students to using strip diagrams. Students can likely represent 6 + 7 by drawing dots. When you draw rectangles around the dots representing the addends and indicate the sum with a question mark, you’ve made a strip diagram that reinforces the part–whole nature of the quantities. Students begin to realize how the two parts come together to make a whole—the box gathers all the dots into one group; they do not appear simply as 13 discrete objects. This activity lays the foundation for the Grade 2 example, in which they start to explore equal parts. Once students know how to draw strip diagrams, they can use them to make sense of many mathematical relationships.
|
Grade 1: Addition |
Grade 2: Making Equal Groups |
 |
 |
Strip diagrams are useful at all grade levels.
When students encounter new challenges, the strip diagram can be a familiar place to start. What once helped with basic whole number arithmetic in primary grades extends to fractions in intermediate grades and even algebra in middle and high school. Let’s look at how students can use strip diagrams to help them make sense of those concepts.
First, we’ll see how students can use the strip diagram to understand operations with fractions in this example from Grade 5.
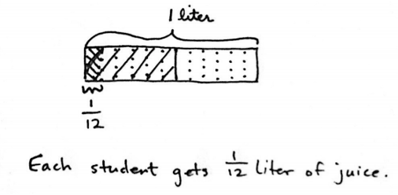
Ms. Hayes has ½ liter of juice. She distributes it equally to 6 students in her tutoring group. How many liters of juice does each student get?
|
Notice how the strip diagram represents the problem. A larger rectangle represents a whole liter. That rectangle is partitioned to show half liters. Then each half liter is partitioned to represent the amount each student gets. The drawing makes meaning of division problems clear in a way that inverting and multiplying does not. |
|

Next, let’s look at an example of an algebraic problem from Grade 7.
Jenny is on the local swim team for the summer and has swim practice four days per week. The schedule is the same each day. The team swims in the morning and then again for 2 hours in the evening. If Jenny swims 12 hours per week, how long does she swim each morning?
| In this case, the strip diagram shows the 4 days of practice, each with an unknown morning practice time, and 2 hours of practice in the evening. Students can use a strip diagram to help write an equation such as 4(𝑥+ 2) = 12. They may also work backward, subtracting the 8 hours inside the strip from the 12 total hours, and then divide the 4 hours equally among the four sections to see that each x represents 1 hour. | 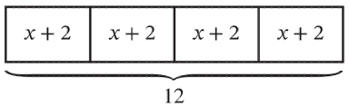
|
Finally, let’s look at an Algebra I problem.
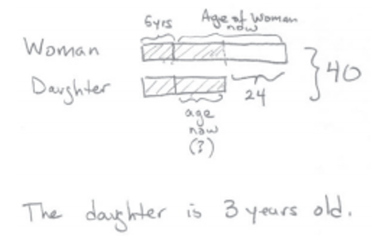
Five years from now, the sum of the ages of a woman and her daughter will be 40 years. The difference in their present age is 24 years. How old is her daughter now?
|
This is a good example of how a strip diagram helps students organize information. The first section of each strip represents 5 years from now. The next section represents the daughter’s age now. The last section of the top strip shows the current age difference, and both strips together represent the total. Students use this drawing to write an equation to find the sum of each section. For example, 5 + x + 24 + 5 + x = 40 or 2x + 34 = 40. |
|
You can introduce students to strip diagrams at any time.
If your students are just beginning to use Eureka Math TEKS, you may wonder how to introduce them to strip diagrams if they didn’t use them in previous years. Consider doing one entire lesson on strip diagrams. During this lesson, use problems from previous grades to keep the focus on understanding strip diagrams and not on learning a new math concept. You’ll be surprised how quickly students understand the model. In fact, students usually embrace it more quickly than teachers, probably because they have fewer years of doing things differently to overcome.
Another suggestion is to scaffold the first problems that students represent with strip diagrams. For example, let’s revisit the Grade 5 problem we looked at previously.
Ms. Hayes has ½ liter of juice. She distributes it equally to 6 students in her tutoring group. How many liters of juice does each student get?
|
Use the following questions to scaffold the problem to support students in representing it.
|
|
Students can draw strip diagrams to make sense of mathematics. Once the strip diagram is a tool in their repertoire, they can use it to solve any number of mathematical problems.
.png)
Asma Akhras
Asma is an implementation leader for LAUSD with Great Minds. She has been in education for over 20 years.
Topics: Implementation Support
.jpg?width=430&name=PhD%20Science%20(1).jpg)


.jpg?width=430&name=EurekaMath%20(1).jpg)
.jpg?width=430&name=WitWisdom%20(1).jpg)


